
Overview on expenditures and revenue
Learn More About the District Budget
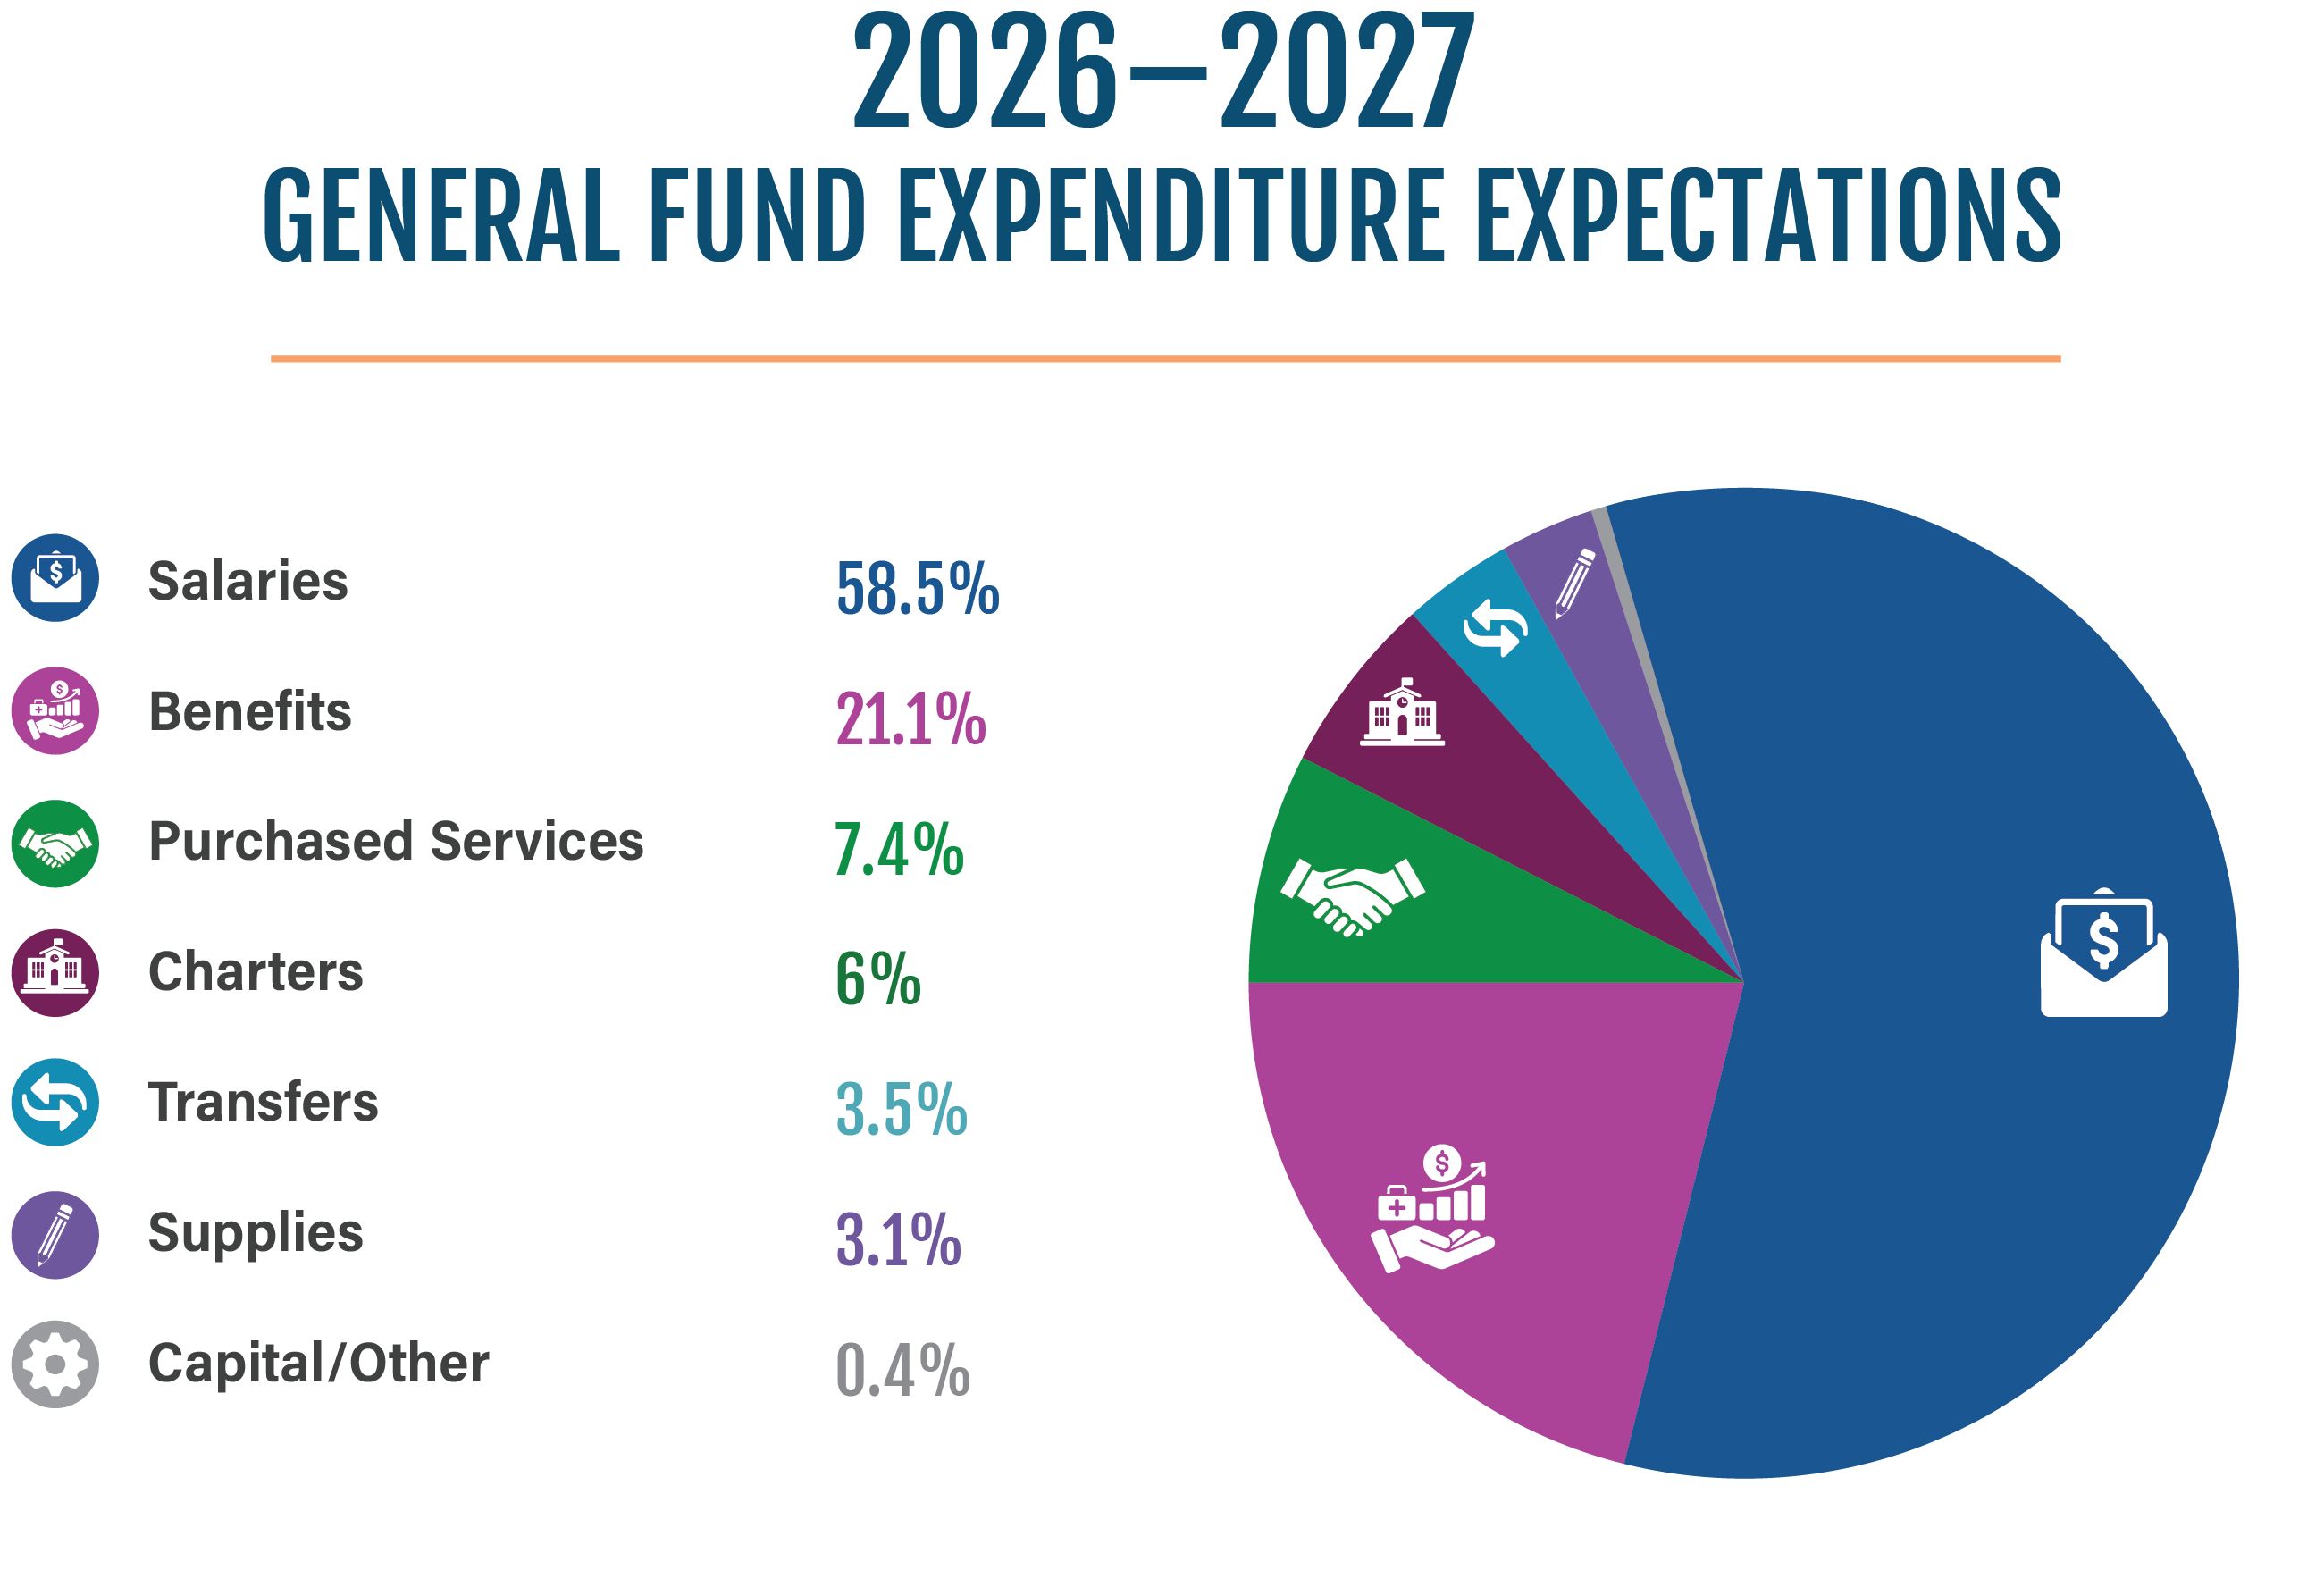
Salaries and benefits make up the primary portion of expected expenditures at approximately 85%, with charter compensation included. Non-personnel costs, led by purchased services, comprise the remainder of the budget.
How LPS Schools are Funded
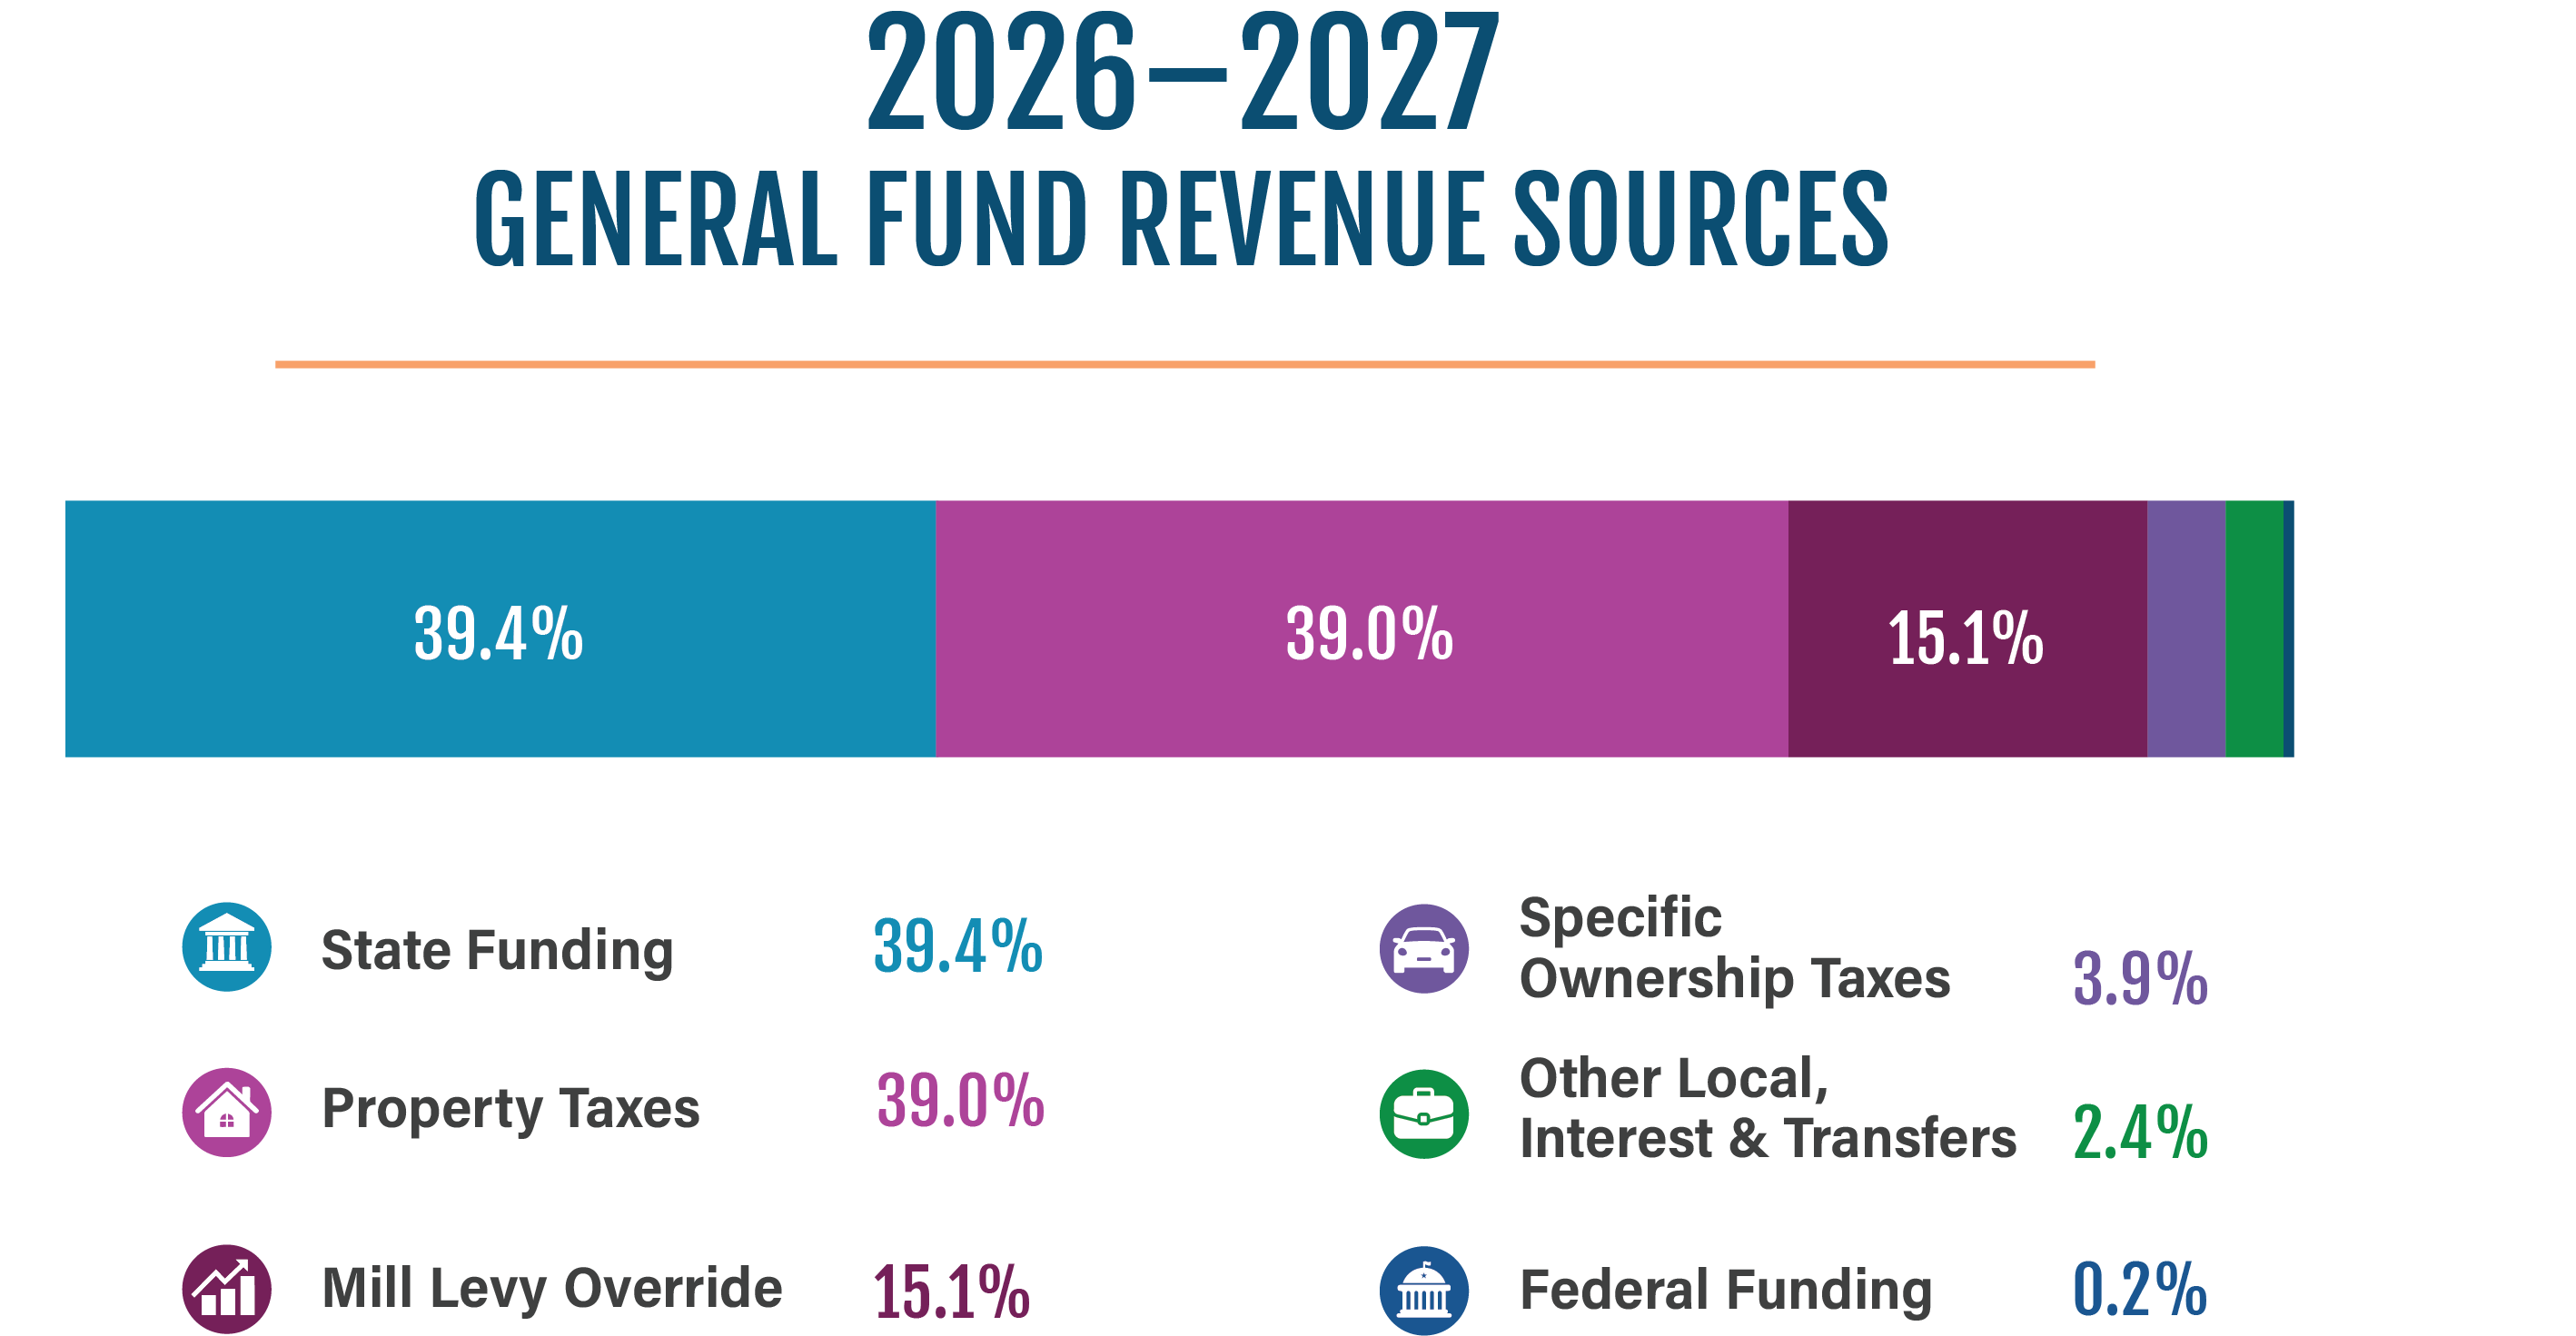
District funding is anchored by state sources (39.4%) and property taxes (39%). Mill levy overrides and specific ownership taxes supply another 19%, with minimal funding coming from federal and other local streams.
LPS is dedicated to open, accountable stewardship of local tax dollars. For detailed financial reports, annual audits, and current budget documents, visit the official financial portal: LPS Financial Transparency.
The LPS Finance Department has been honored with the Certificate of Achievement in Excellence in Financial Reporting by the Government Finance Officers Association (GFOA) for 32 consecutive years, which is the highest form of recognition in governmental accounting and financial reporting. According to the GFOA, receiving this award “represents a significant accomplishment by a government and its management.”